

That’s where AVERAGEIF and AVERAGEIFS come in. This guide explains the difference between AVERAGEIF and AVERAGEIFS, how each function works, and when you should use one over the other.
What Is AVERAGEIF?
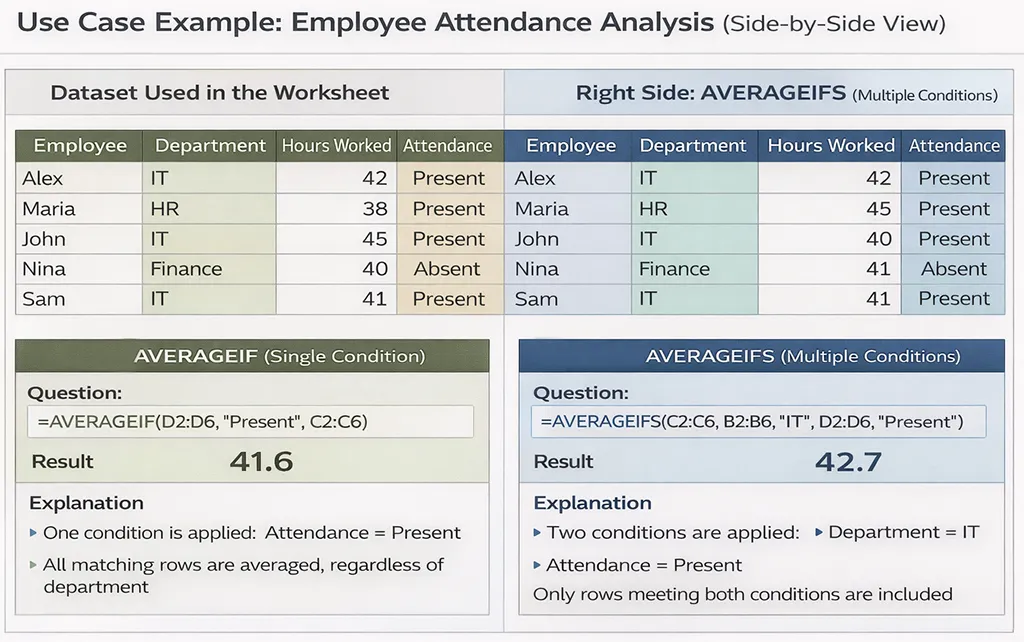
AVERAGEIF calculates the average of a range of values based on a single condition. It filters the data first, then averages only the values that meet your criteria.
Syntax
AVERAGEIF(range, criteria, [average_range])
Arguments Explained
- range – The cells Excel evaluates against the condition
- criteria – The rule to apply (text, number, expression, or cell reference)
- average_range (optional) – The values to average; if omitted, Excel averages the range itself
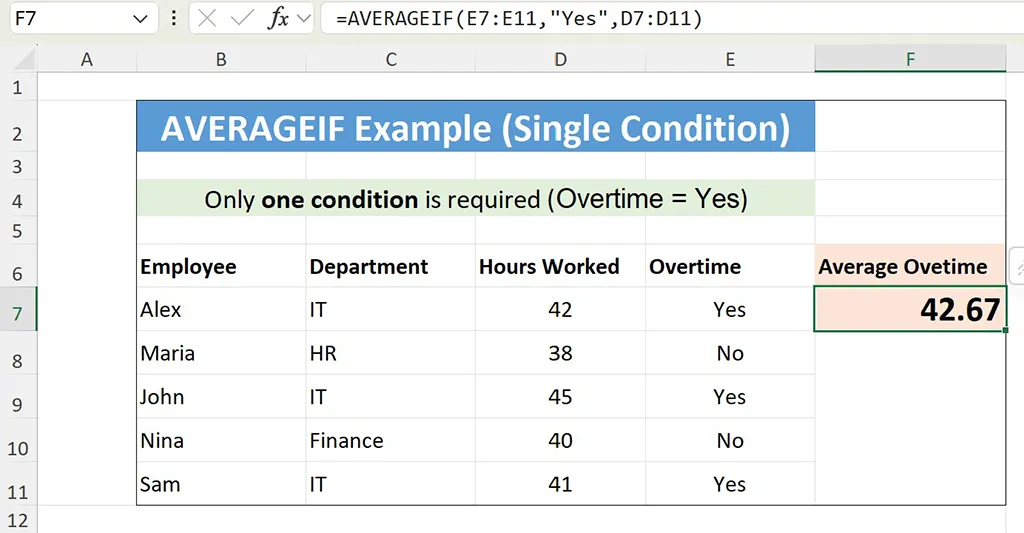
AVERAGEIF Example (Single Condition)
Scenario
You want to calculate the average number of hours worked by employees who logged overtime.
Sample data
- Alex (IT) – 42 hours – Overtime: Yes
- Maria (HR) – 38 hours – Overtime: No
- John (IT) – 45 hours – Overtime: Yes
- Nina (Finance) – 40 hours – Overtime: No
- Sam (IT) – 41 hours – Overtime: Yes
Formula
=AVERAGEIF(D2:D6,”Yes”,C2:C6)
Result
42.67
Only hours from employees who logged overtime are included in the calculation.
What Is AVERAGEIFS?
AVERAGEIFS calculates an average based on multiple conditions. Every condition must be true for a value to be included, which makes it ideal for structured reporting.
Syntax
AVERAGEIFS(average_range, criteria_range1, criteria1, [criteria_range2, criteria2], …)
Key Difference in Syntax
- average_range always comes first
- You can apply multiple criteria ranges and conditions
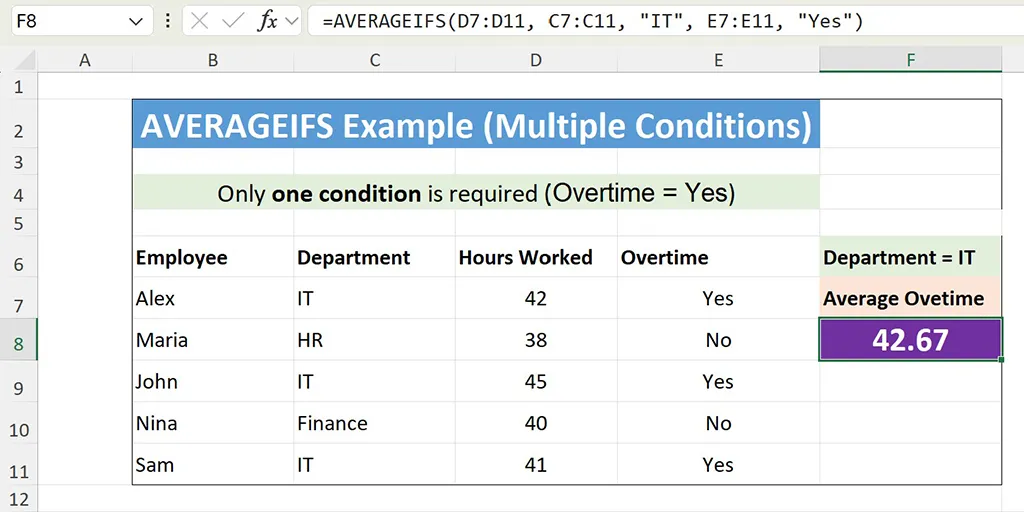
AVERAGEIFS Example (Multiple Conditions)
Scenario
You want to calculate the average number of hours worked by employees who:
- Work in the IT department
- Logged overtime
Formula
=AVERAGEIFS(C2:C6,B2:B6,”IT”,D2:D6,”Yes”)
Result
42.67
Only rows meeting both conditions are averaged.
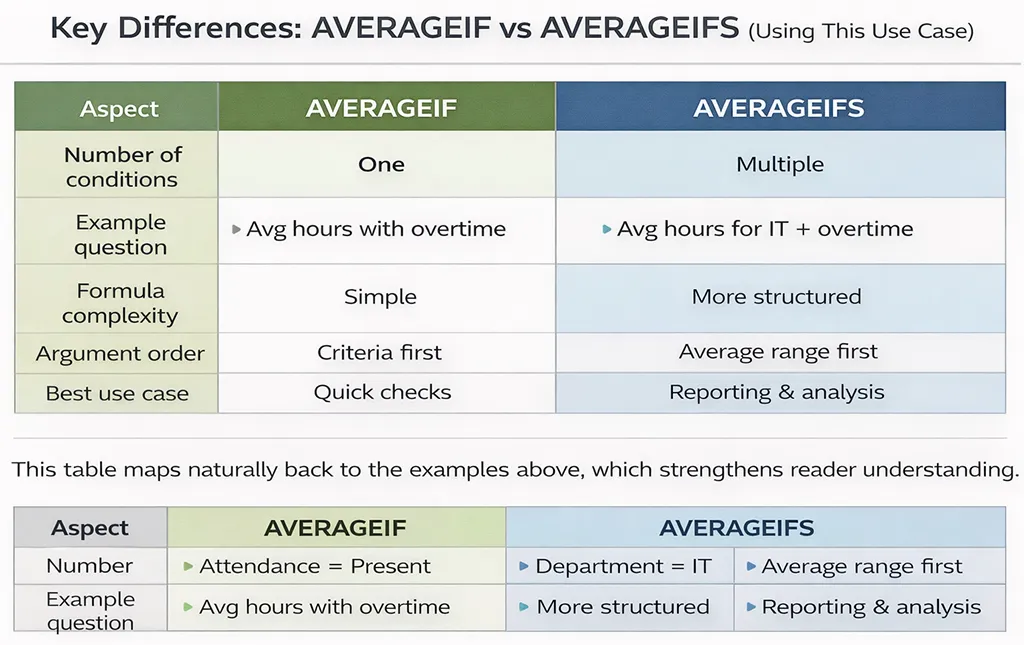
Key Differences: AVERAGEIF vs AVERAGEIFS
- Number of conditions: AVERAGEIF = one, AVERAGEIFS = multiple
- Average range position: AVERAGEIF = optional and last; AVERAGEIFS = required and first
- Complexity: AVERAGEIF = simpler; AVERAGEIFS = more flexible
- Use case: AVERAGEIF = quick checks; AVERAGEIFS = reporting and analysis
Criteria Examples You Can Use in Both Functions (Timesheet Context)
In employee timesheet analysis, criteria define which work-hour records should be included in an average. Both AVERAGEIF and AVERAGEIFS use the same types of criteria, allowing you to filter data based on department, hours worked, overtime status, or flexible thresholds.
- Text criteria:
"IT"
Used to include only employees who belong to the IT department. This is helpful when comparing workload or performance across different teams. - Numeric criteria:
">40"
Includes only employees who worked more than 40 hours, which is commonly used to analyze overtime patterns or high workloads. - Cell-based criteria:
">"&F1
Allows the hour threshold to be controlled by a cell value. This makes the analysis flexible, letting managers adjust the cutoff (for example, 38, 40, or 45 hours) without changing the formula. - Boolean-style text:
"Yes"
Used to filter records where overtime was logged. This is useful when calculating average hours only for employees who exceeded their standard schedule. - Wildcard criteria:
"Fin*"
Matches any department name that starts with “Fin,” such as Finance or Financial Operations. Wildcards are helpful when department names vary slightly but follow a common pattern.
Common Mistakes to Avoid
1. Mixing Up Argument Order
- AVERAGEIF checks the criteria range first
- AVERAGEIFS starts with the average range
2. Mismatched Range Sizes
All criteria ranges must match the size of the average range.
3. Forgetting Quotes for Text Criteria
Incorrect:
=AVERAGEIF(D2:D6,Yes,C2:C6)
Correct:
=AVERAGEIF(D2:D6,”Yes”,C2:C6)
Performance and Best Practices
- Use AVERAGEIF for simple checks and dashboards
- Use AVERAGEIFS for structured reporting
- Store criteria in cells to make formulas reusable
- Ensure source data is clean and consistent
Summary: Which One Should You Choose?
- Use AVERAGEIF when one condition is enough
- Use AVERAGEIFS when multiple conditions are required
Both functions are essential for analyzing real-world data, and choosing the right one helps keep your spreadsheets accurate, readable, and scalable.