

Overview of the Function
The FORECAST function predicts a future numeric value based on existing historical data using linear regression. In plain terms, it estimates what a value is likely to be if a current trend continues.
Users typically need the FORECAST function when projecting sales, revenue, demand, or performance metrics based on past results.
The function is supported in both Google Sheets and Excel. In newer versions of Excel, FORECAST is maintained for compatibility, while newer alternatives like FORECAST.LINEAR are also available.
Key Features and Use Cases
The FORECAST function helps users estimate future outcomes without manually calculating regression formulas. It replaces complex statistical calculations and reduces the need for helper columns or trendline charts.
Users commonly search for this function when they need quick, formula-driven predictions directly inside a spreadsheet.
Platform Compatibility
- Works in Google Sheets
- Works in Excel (all modern versions)
Sample Data Used in Examples
The examples below use a simple dataset with time-based values and corresponding results.
Month	Sales
1	1200
2	1350
3	1420
4	1600
5	1700
Function Syntax
Syntax
=FORECAST(x, known_ys, known_xs)Predicts a future value by extending a linear trend from existing data.
Syntax Description
- x – The future value of the independent variable you want to forecast.
- known_ys – The known dependent values (historical results).
- known_xs – The known independent values (historical inputs).
How to Use in Google Sheets
Click the cell where you want the forecasted result to appear. Enter the FORECAST formula using your historical data ranges. Press Enter, and the predicted value will display.
How to Use in Excel
Select the destination cell, type the FORECAST formula, and press Enter. Excel calculates the result instantly without requiring array entry.
Example 1: Basic Sales Forecast
Platform: Excel and Google Sheets
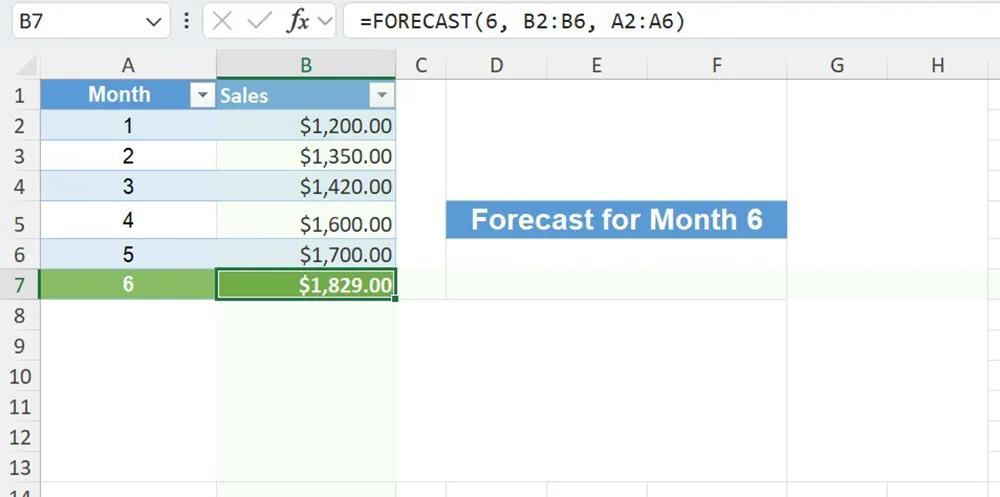
You want to estimate sales for month 6 based on the existing sales trend.
Click cell B7 and enter the formula below.
=FORECAST(6, B2:B6, A2:A6)The formula uses past sales data to estimate sales for month 6.
Example 2: Real-World Revenue Projection
Platform: Excel and Google Sheets
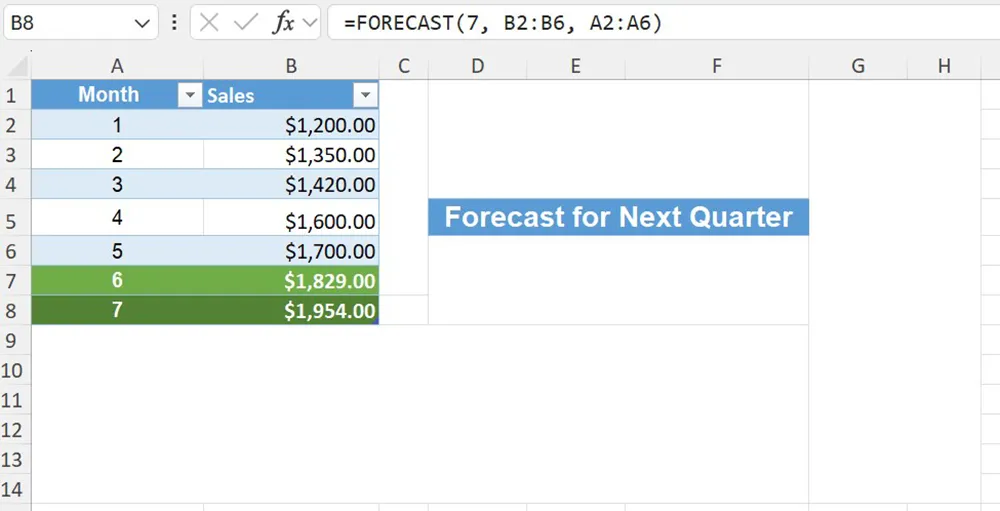
A business wants to project next quarter revenue using monthly historical data.
Enter the formula in the forecast cell referencing the future period number.
=FORECAST(7, B2:B6, A2:A6)This extends the existing revenue trend forward by one period.
Example 3: FORECAST Error Due to Mismatched Ranges
Platform: Excel and Google Sheets
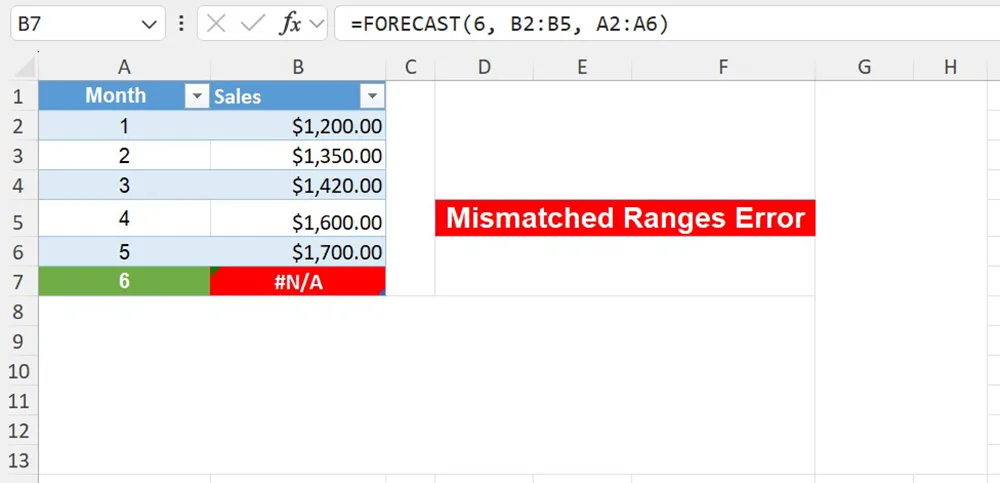
If the known_xs and known_ys ranges are different sizes, the function returns an error.
=FORECAST(6, B2:B5, A2:A6)Ensure both ranges contain the same number of cells.
Function vs Alternatives
Use FORECAST for quick linear predictions. For non-linear trends, chart trendlines or regression tools may be better. Helper columns and manual calculations are slower and more error-prone.
Common Errors and Fixes
- Mismatched data ranges – Ensure equal lengths.
- Non-numeric values – Remove text or blanks.
- Outliers skew results – Clean data before forecasting.
Practical Use Cases
- Sales and revenue forecasting
- Inventory demand planning
- Performance trend analysis
- Budget projections
Final Thoughts
The FORECAST function is ideal when you need fast, linear predictions inside a spreadsheet. Use clean, consistent historical data and remember that results assume the existing trend continues.